
Data Visualisation & Reports
Charts, maps & reports, made from your own figures.
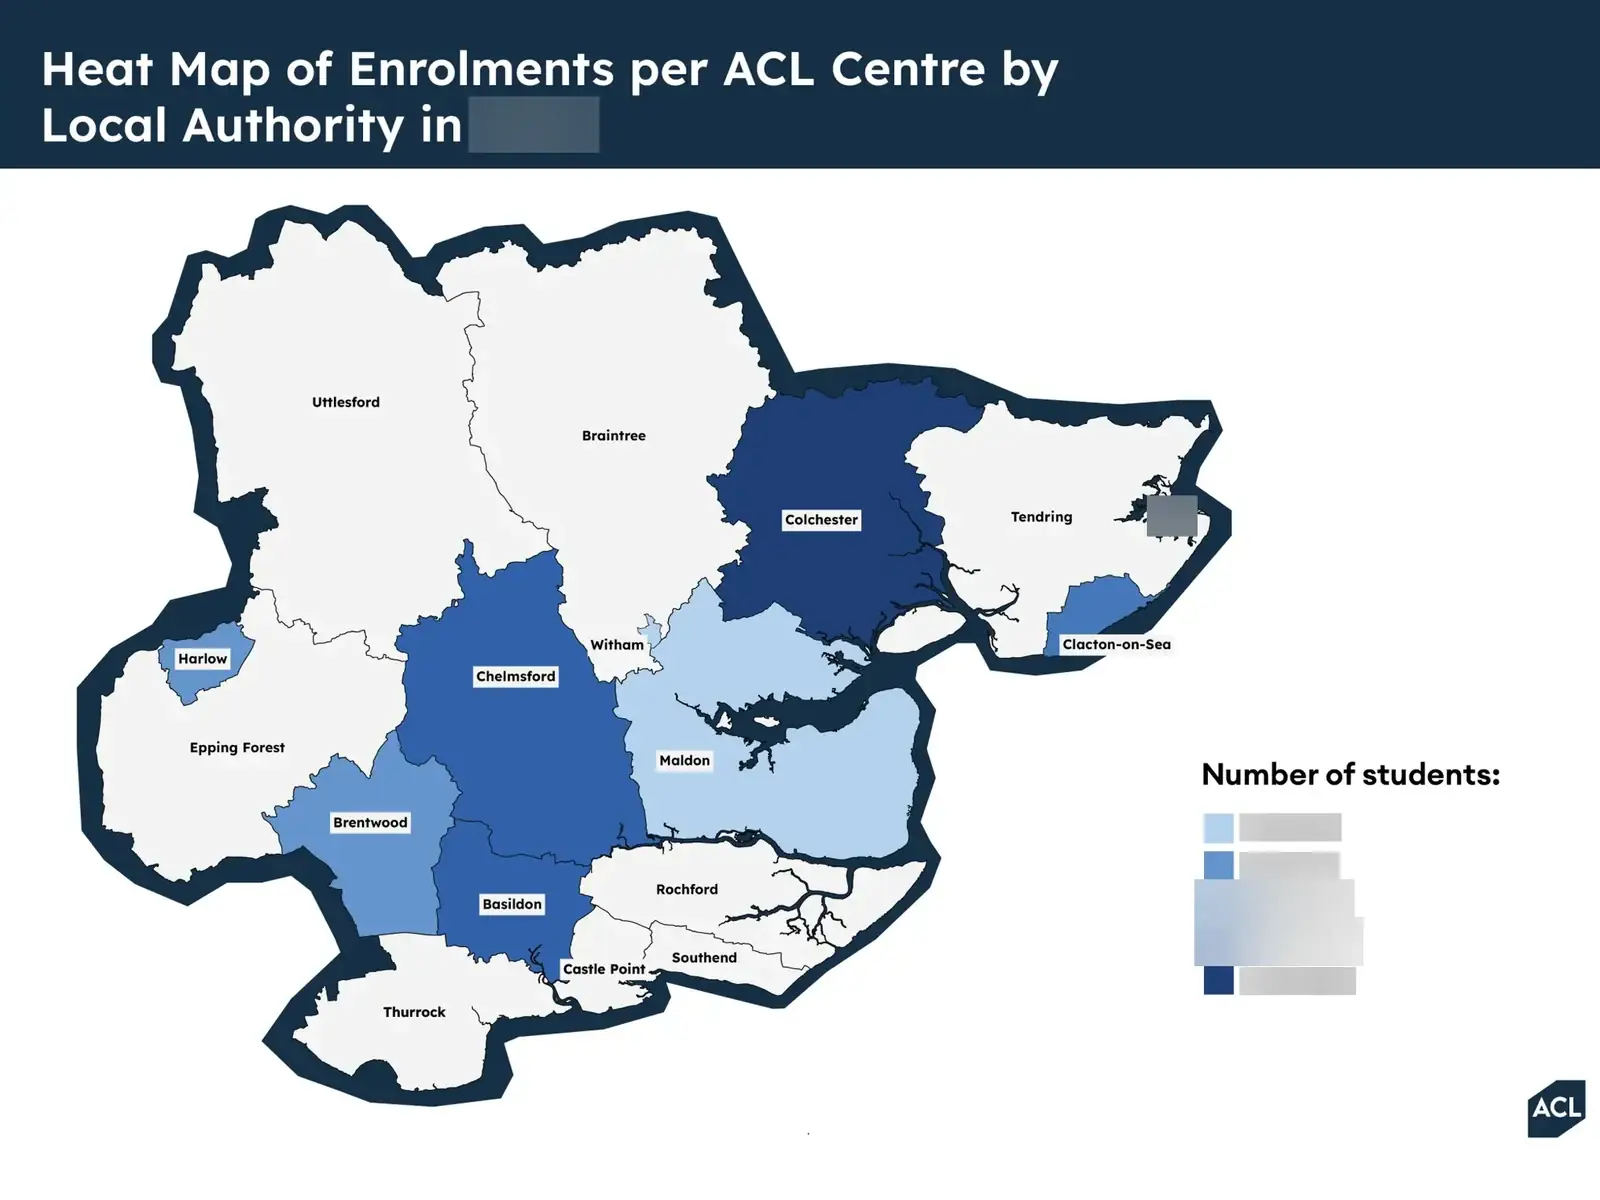
Charts for a document you're laying out yourself, a whole annual, strategy or sustainability report, or custom maps, like heat maps of London boroughs.
From £700, from 1 week
Recent Work
A Table Becomes a Chart
Real Department for Education figures, as you'd get them in a spreadsheet. Press the button to see what I do with them.
Adults in Government-Funded Further Education, England
Learners aged 19 and over, millions
| Academic year | Learners aged 19 and over |
|---|---|
| 2019/20 | 1,745,800 |
| 2020/21 | 1,640,300 |
| 2021/22 | 1,719,600 |
| 2022/23 | 1,818,480 |
| 2023/24 | 1,830,650 |
| 2024/25 | 1,798,970 |
Participation fell 6% in the first Covid year, 2020/21, and has been back at about 1.8 million since 2022/23.
Prices
Starting points, with a fixed quote after our first call. Times run from that call to your final files, feedback included. No VAT is added.
Charts & Infographics
From £700
from 1 week
The charts your document needs, from your own figures, as PNG and PDF ready for your layout.
Ask About ThisCharts & Full Report
From £1,400
from 2 weeks
The charts and the whole report around them, such as an annual, strategy or sustainability report. Print-ready PDFs for coated and uncoated paper, an accessible PDF and PNGs.
Priced for a report of around 16 pages; longer reports are quoted.
Ask About ThisMaps & Recurring Reports
From £2,800
from 4 weeks
Custom data maps, like the London borough heat maps, or a report designed as a template you can reuse each year.
Quoted per project.
Ask About ThisCustom
Fixed quote
within three working days
Need something that isn't listed here, or a mix of services? Tell me what you need, your deadline and your budget if you have one.
Ask for a QuoteHow a Project Runs
Discovery
Send a short note and you'll get a reply within three working days. On a free 20-minute call we agree audience, formats and budget. A fixed quote follows, before any work begins.
Direction
Early ideas, before anything is polished. You pick one, and it sets the course.
Development
I build the full set and share it as it takes shape, with the feedback rounds set out in your quote.
Delivery
I check every detail. Once you sign off, you get the files in the formats your team needs.
Questions
No. Conceptual Studio isn't VAT registered, so the quote is what you pay.
Charts come as PNG and PDF. A full report comes as print-ready PDFs for coated and uncoated paper, an accessible PDF and PNGs of every chart.
Yes. They're drawn in your colours and typefaces, as if your own team made them.
Charts from 1 week, a report of around 16 pages from 2 weeks, from our first call to your final files. Longer reports are quoted.
Yes. I build the report as a template, so next year starts from your new figures.
Ask for a Quote
Tell me what you're working on, and I'll be in touch.
Or email your brief to [email protected]. The form can't take attachments.