NCC Strategic Intent
Seven infographics for the college's Strategic Intent document, used by its senior leadership.
- Client
- New City College London
- Disciplines
- Data visualisation, Graphic design
- Year
- 2025
The Problem
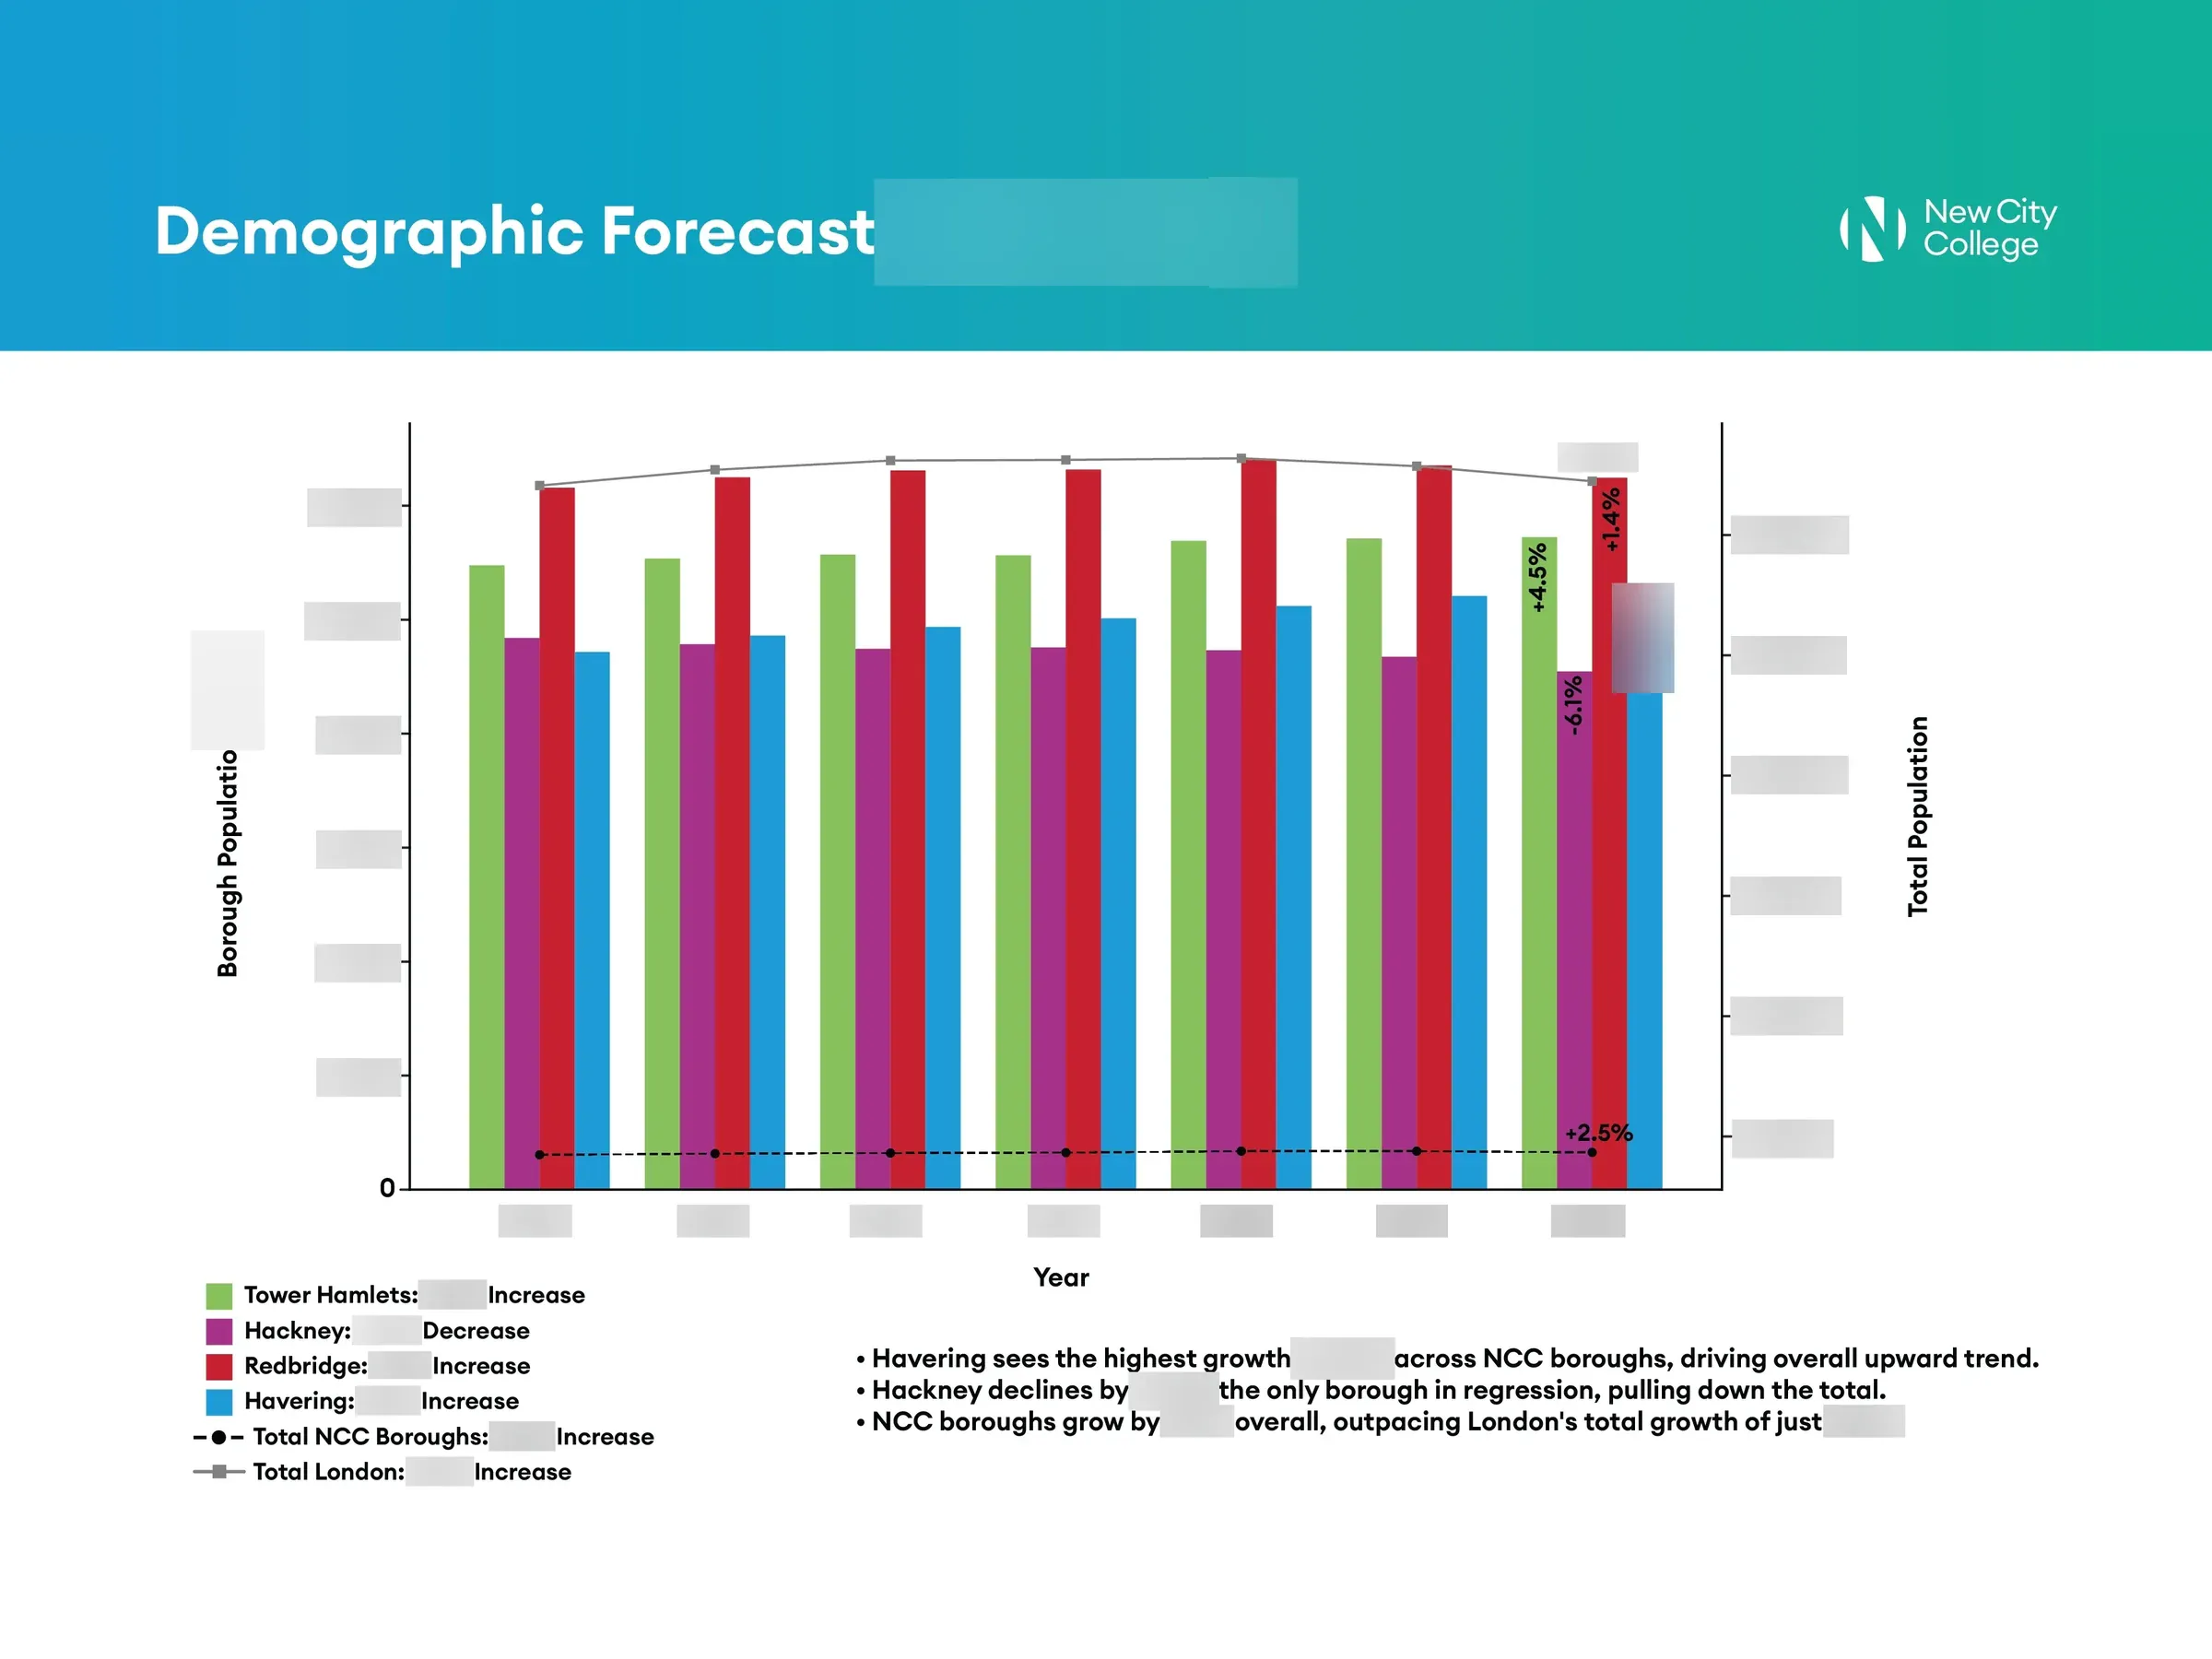
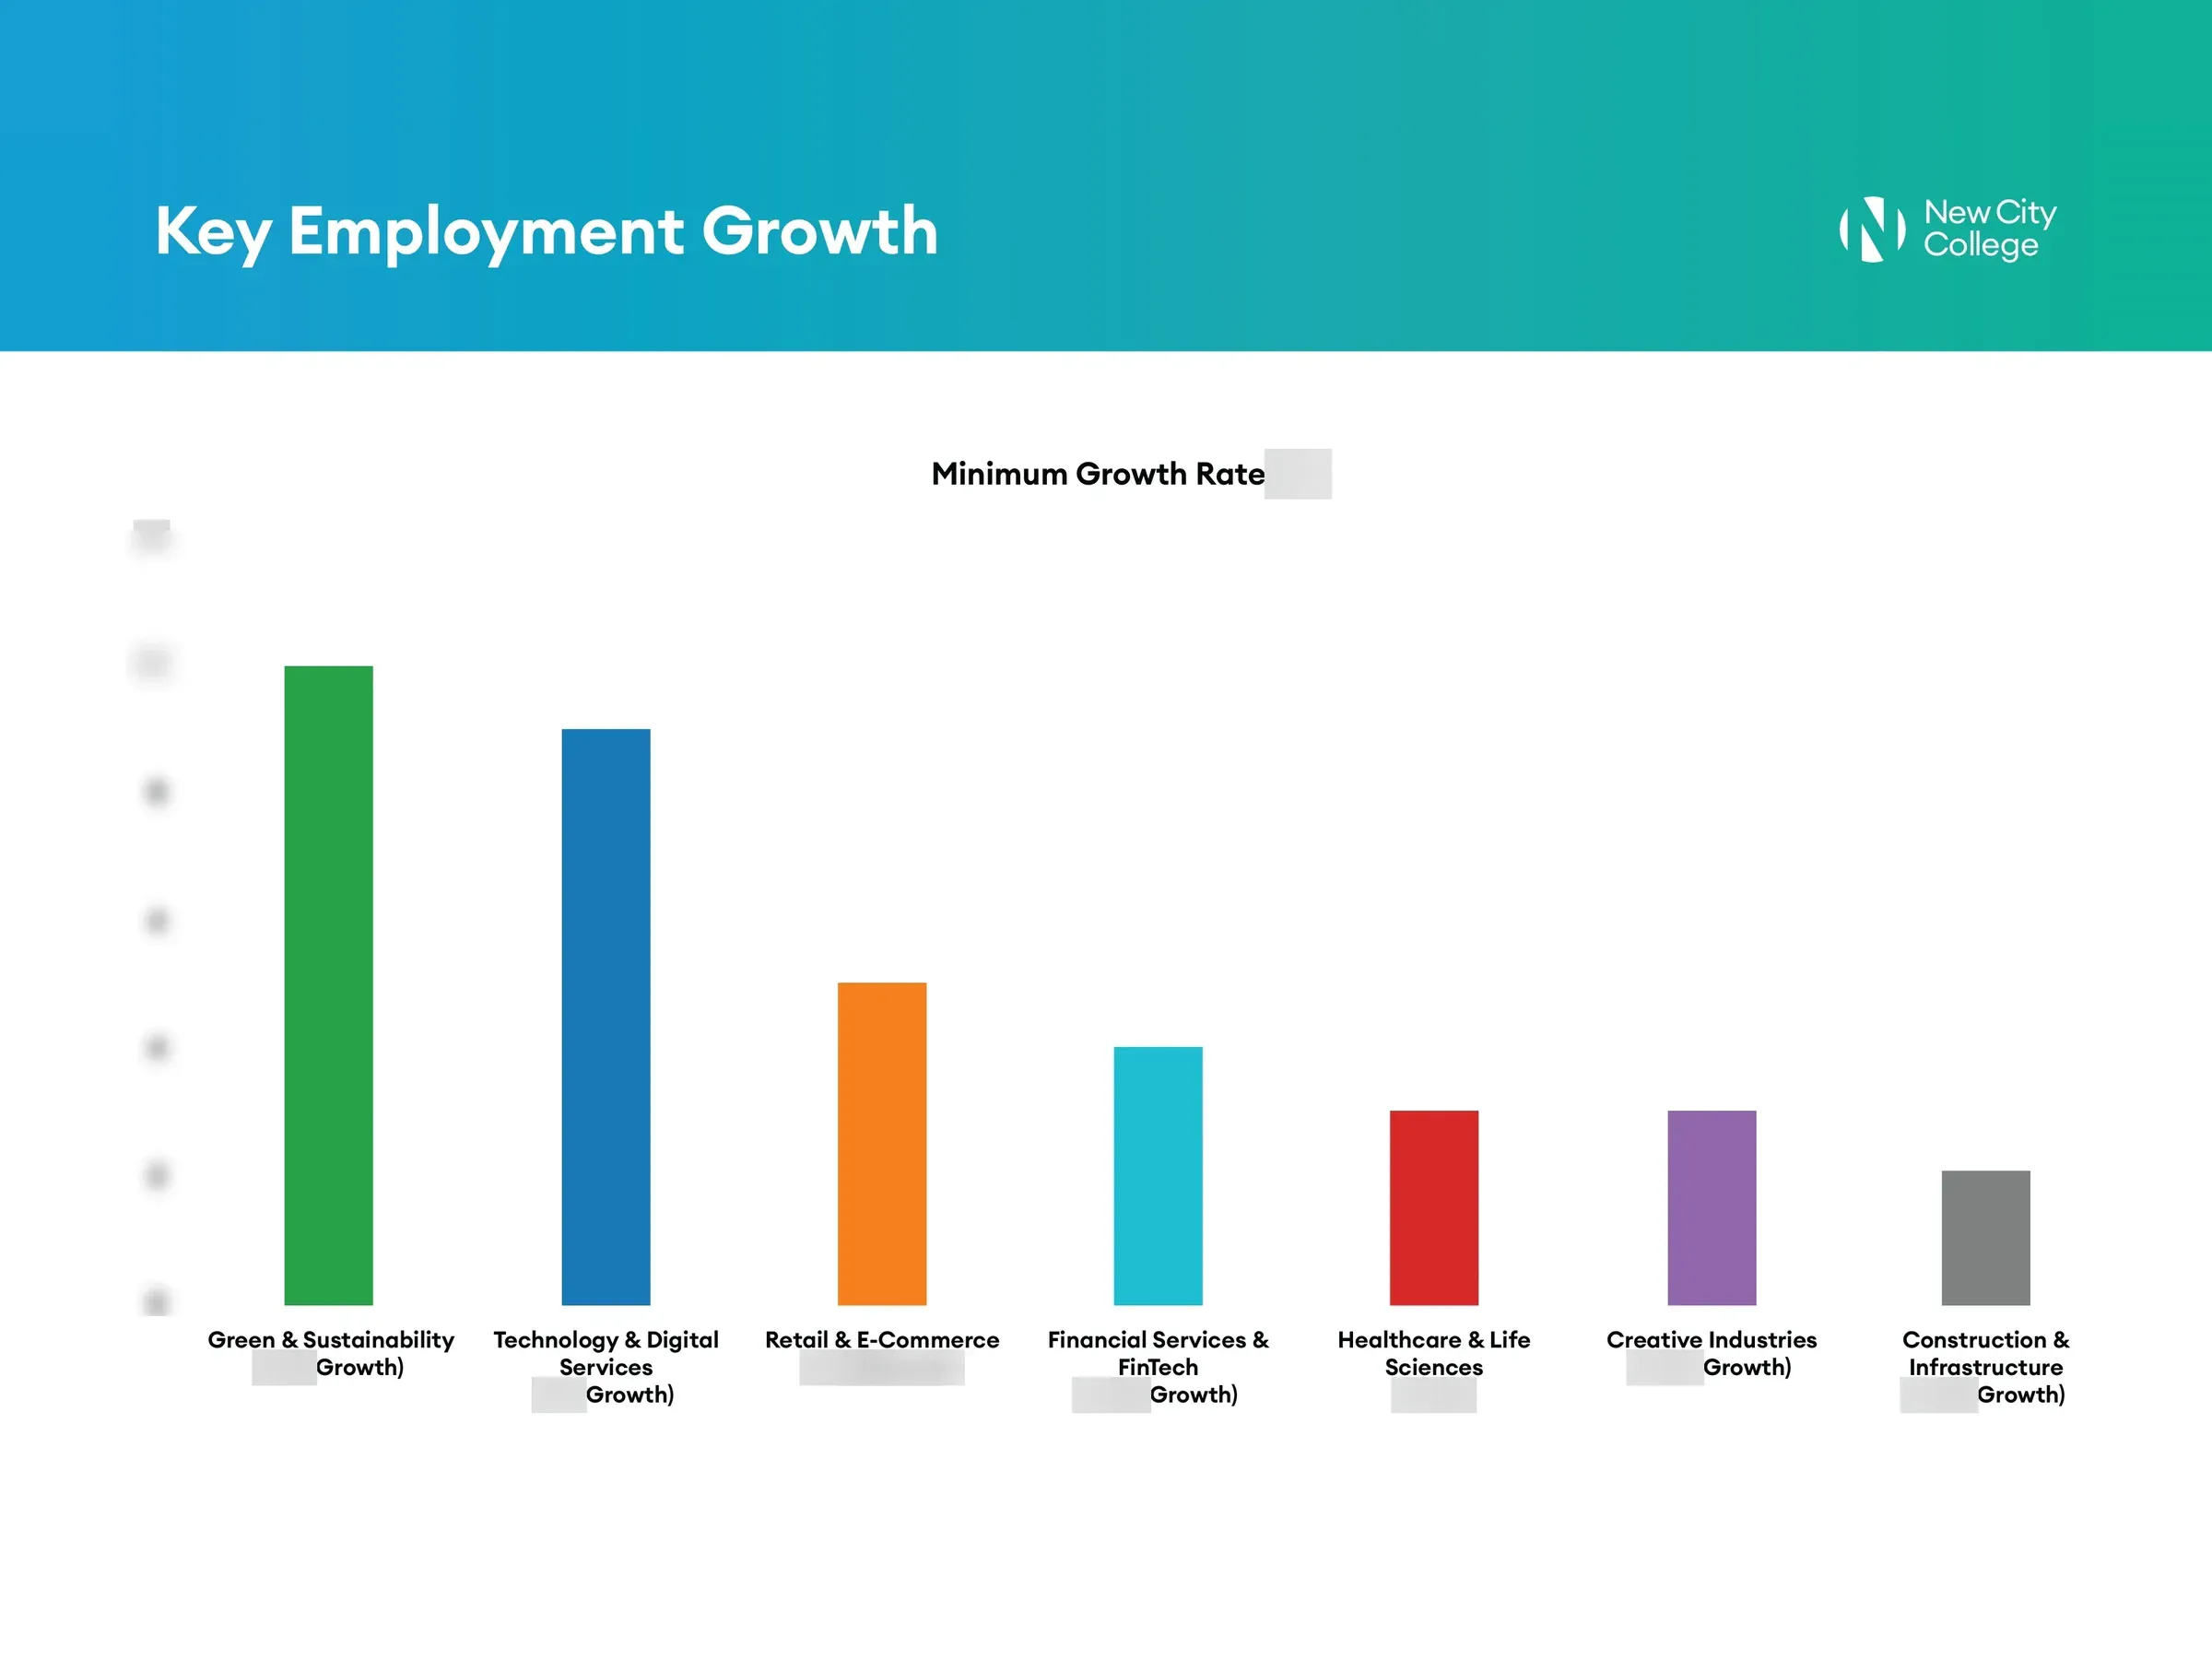
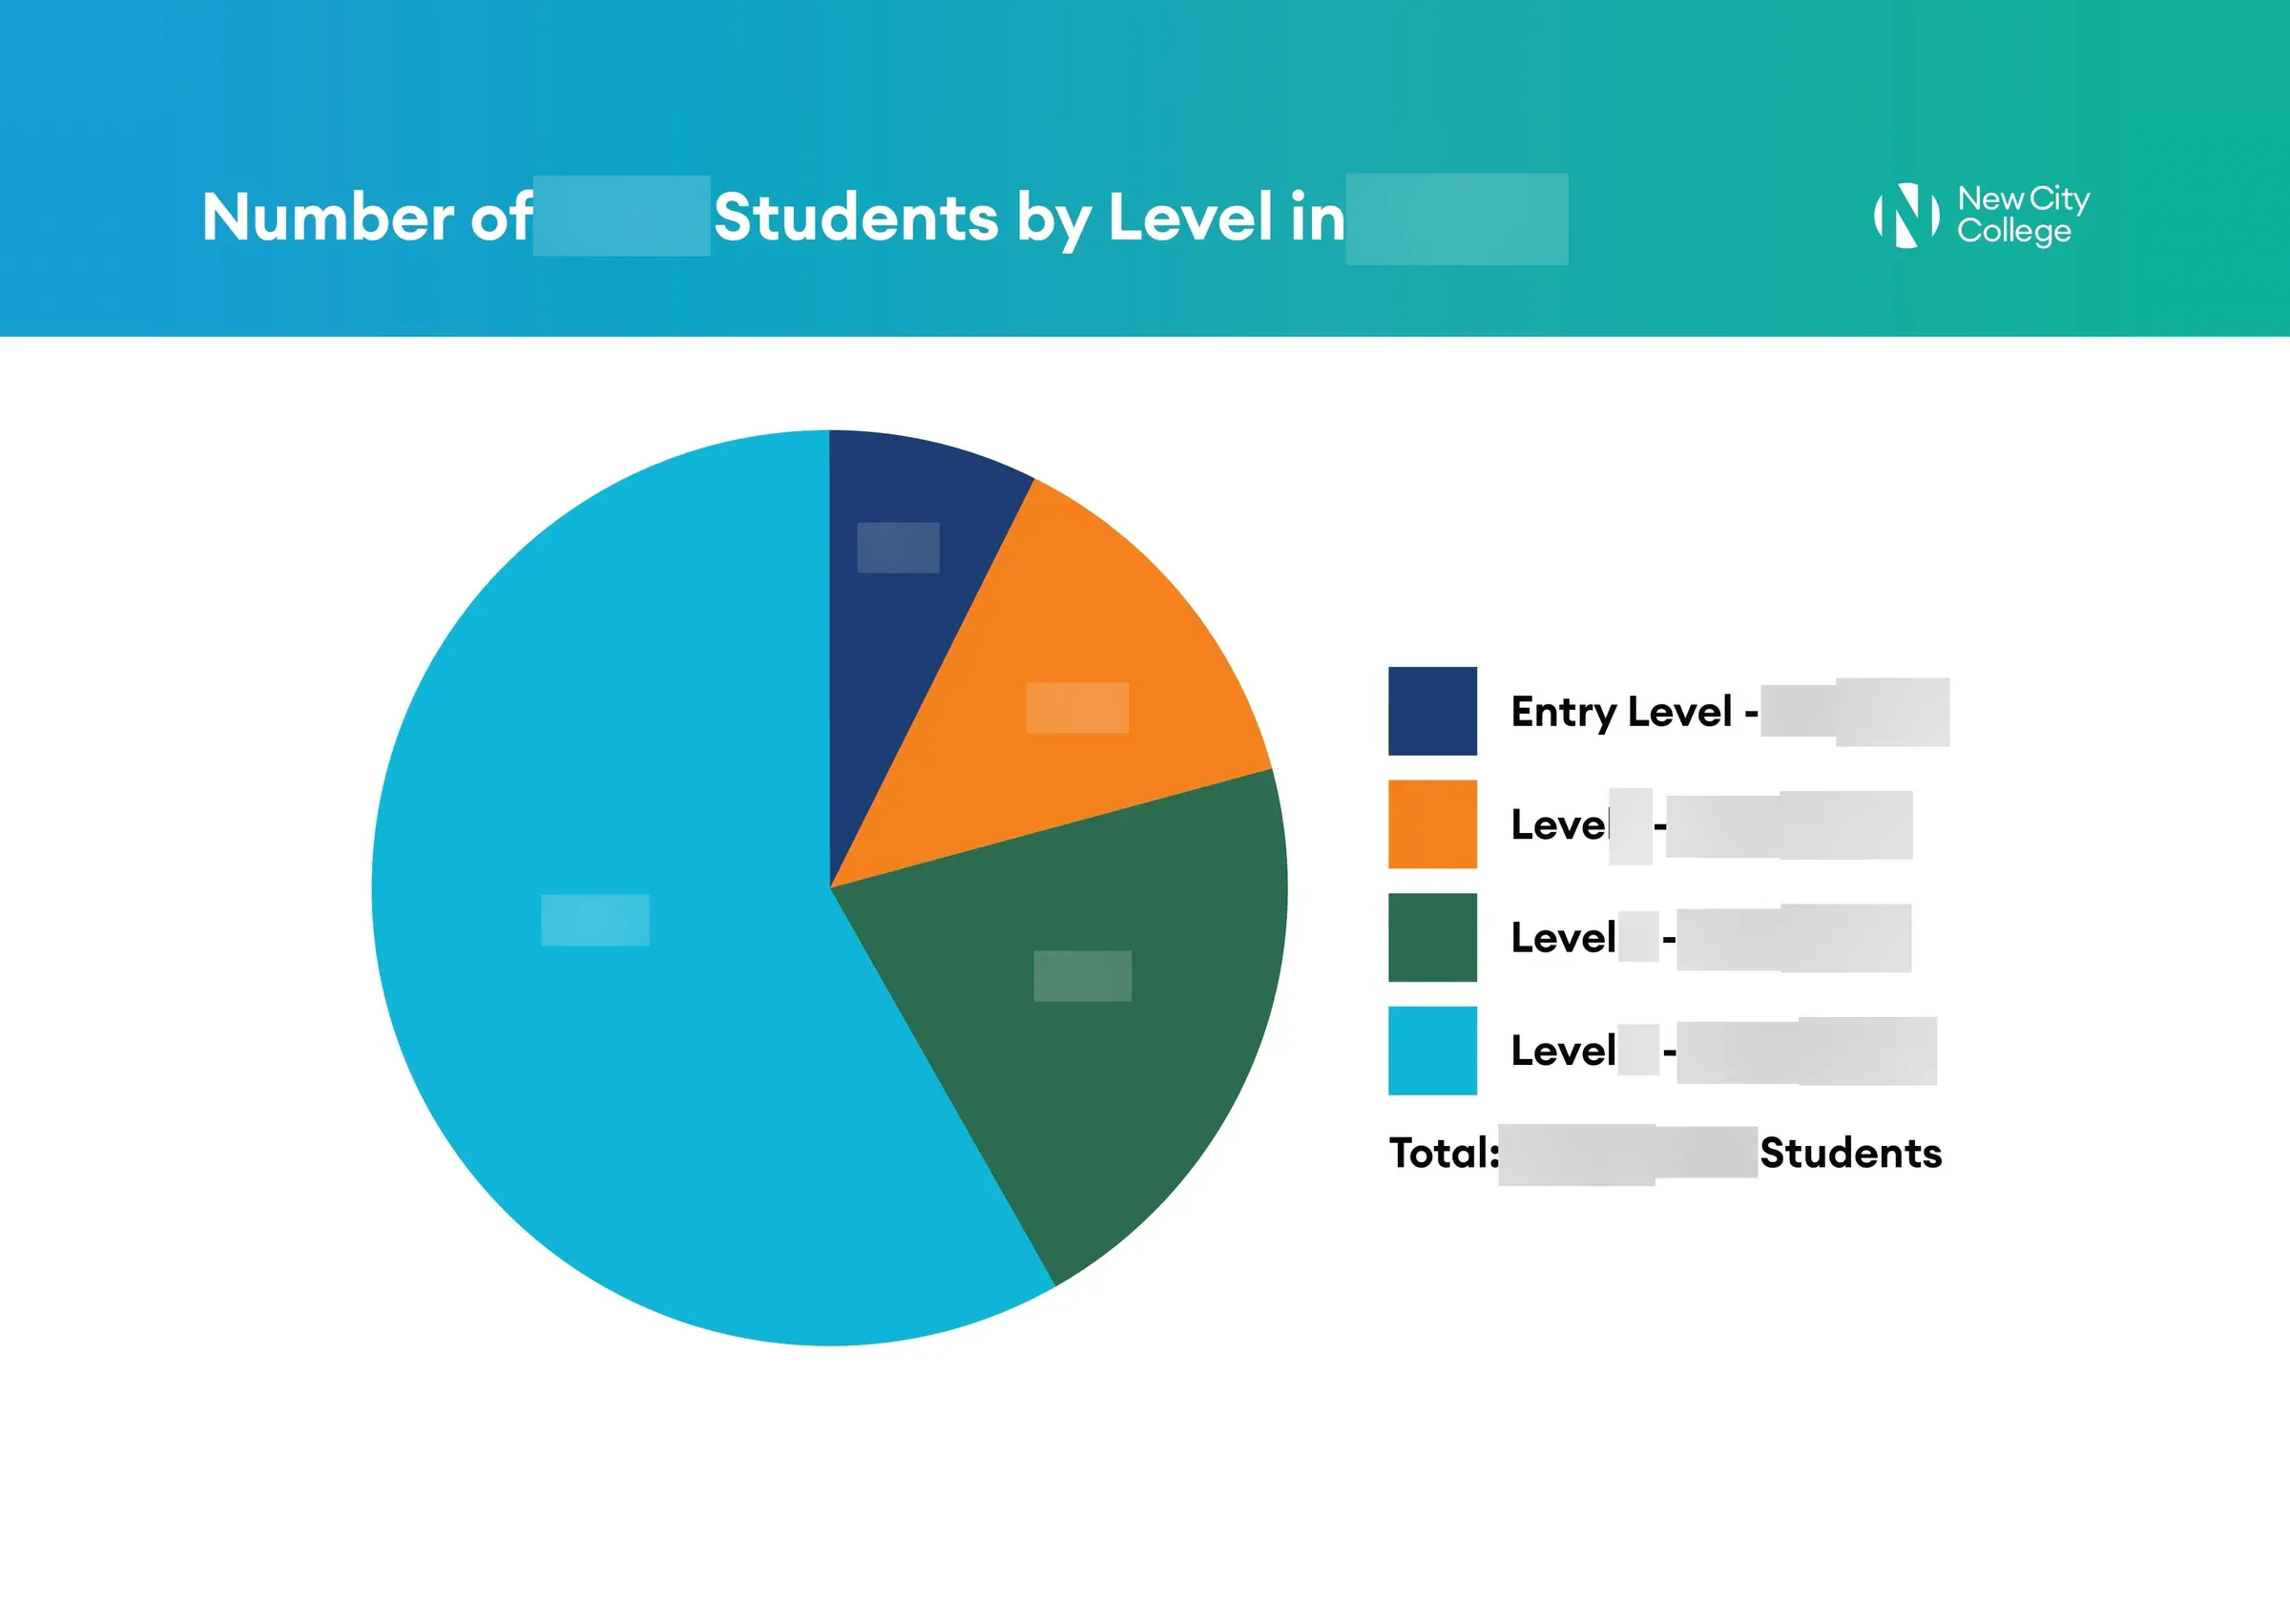
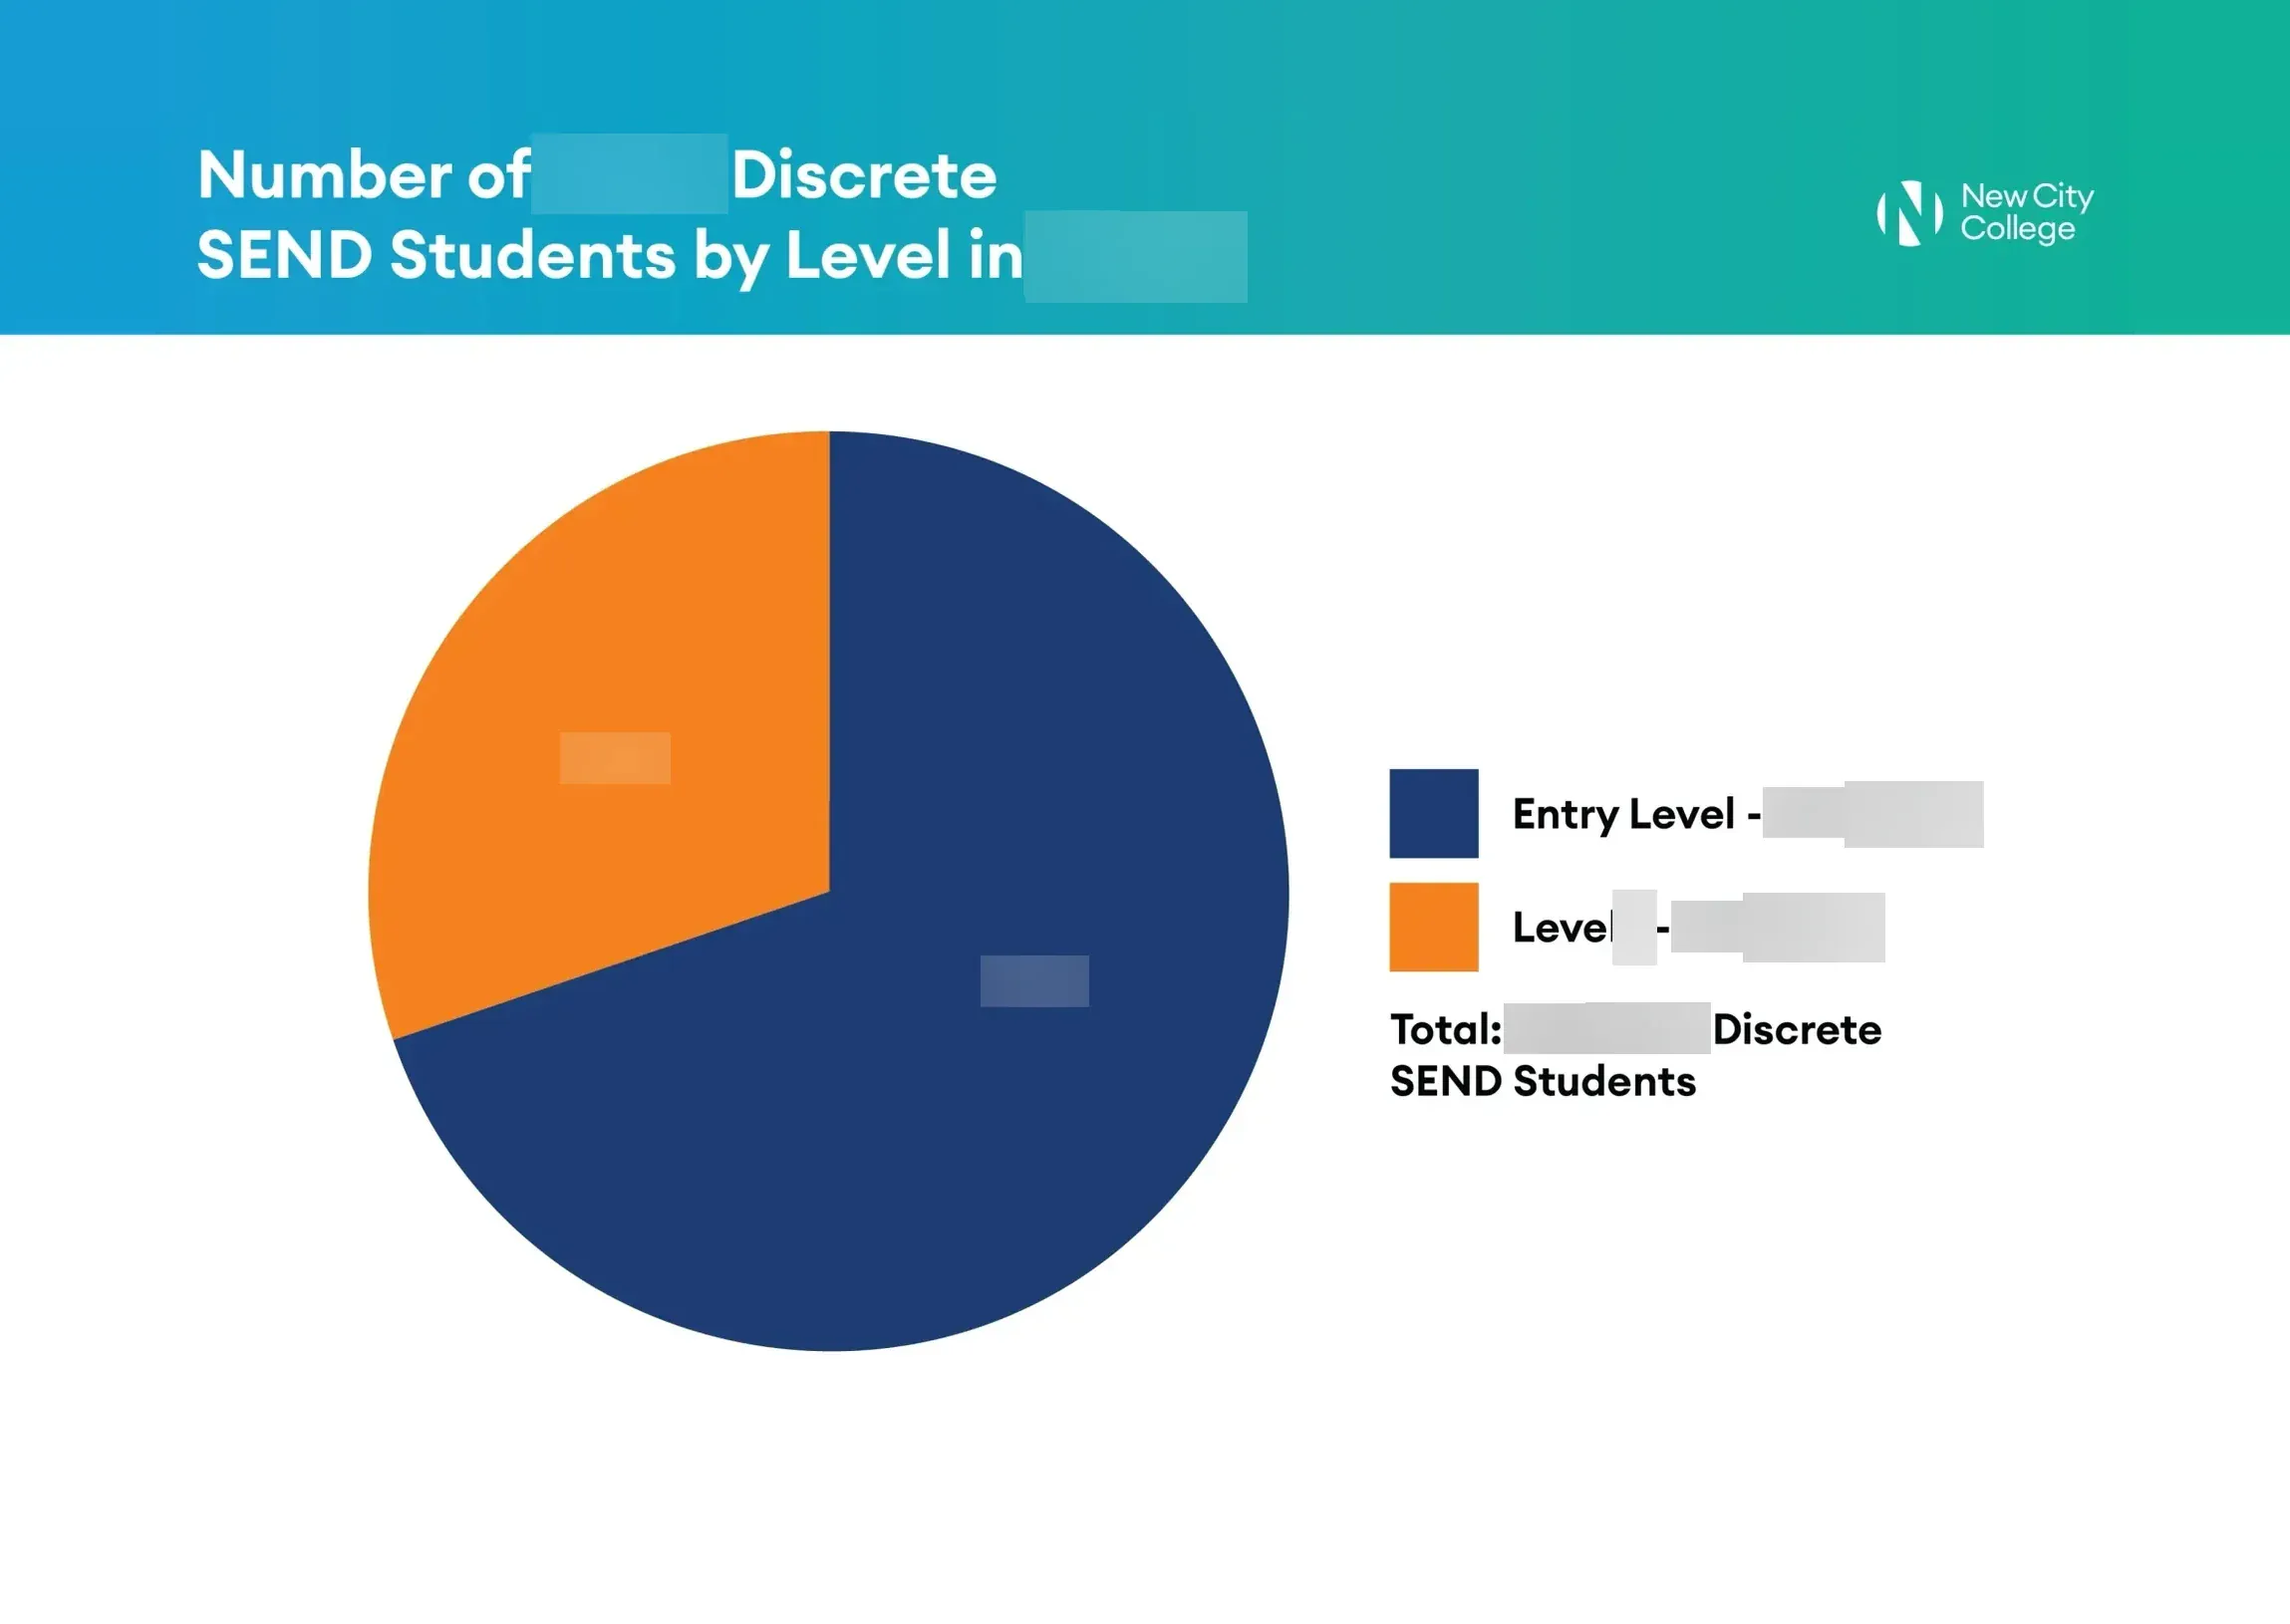
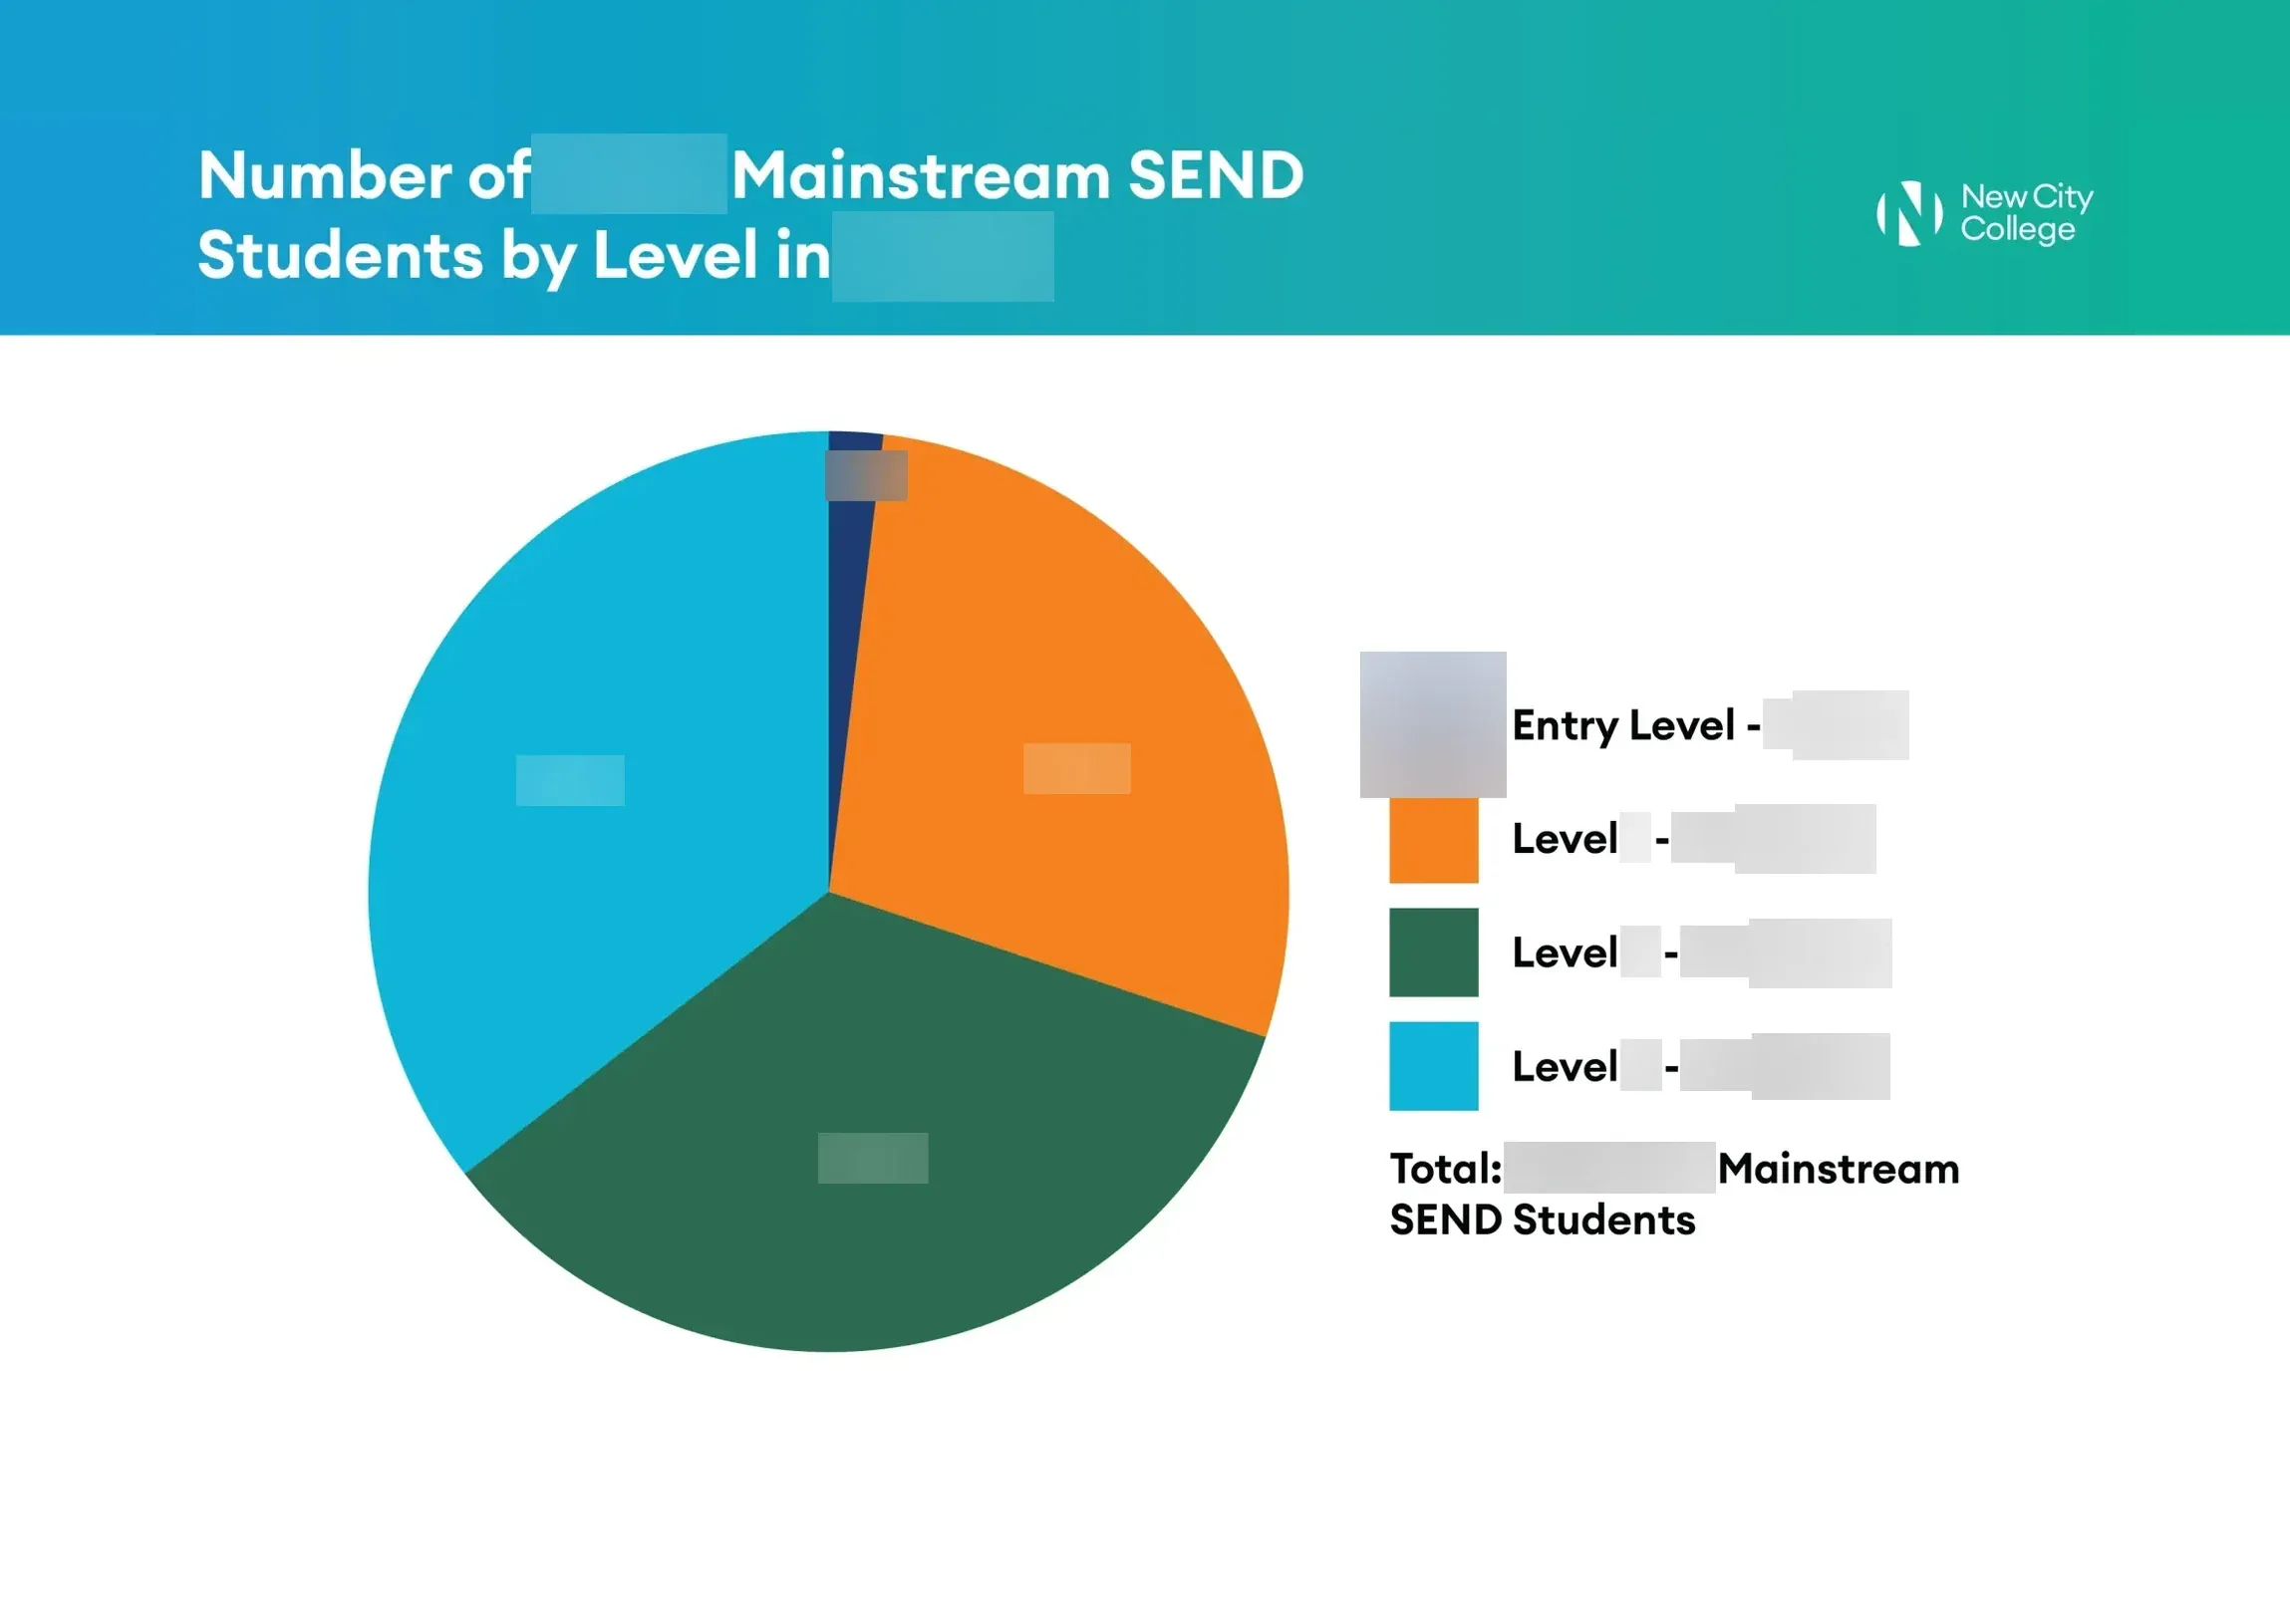
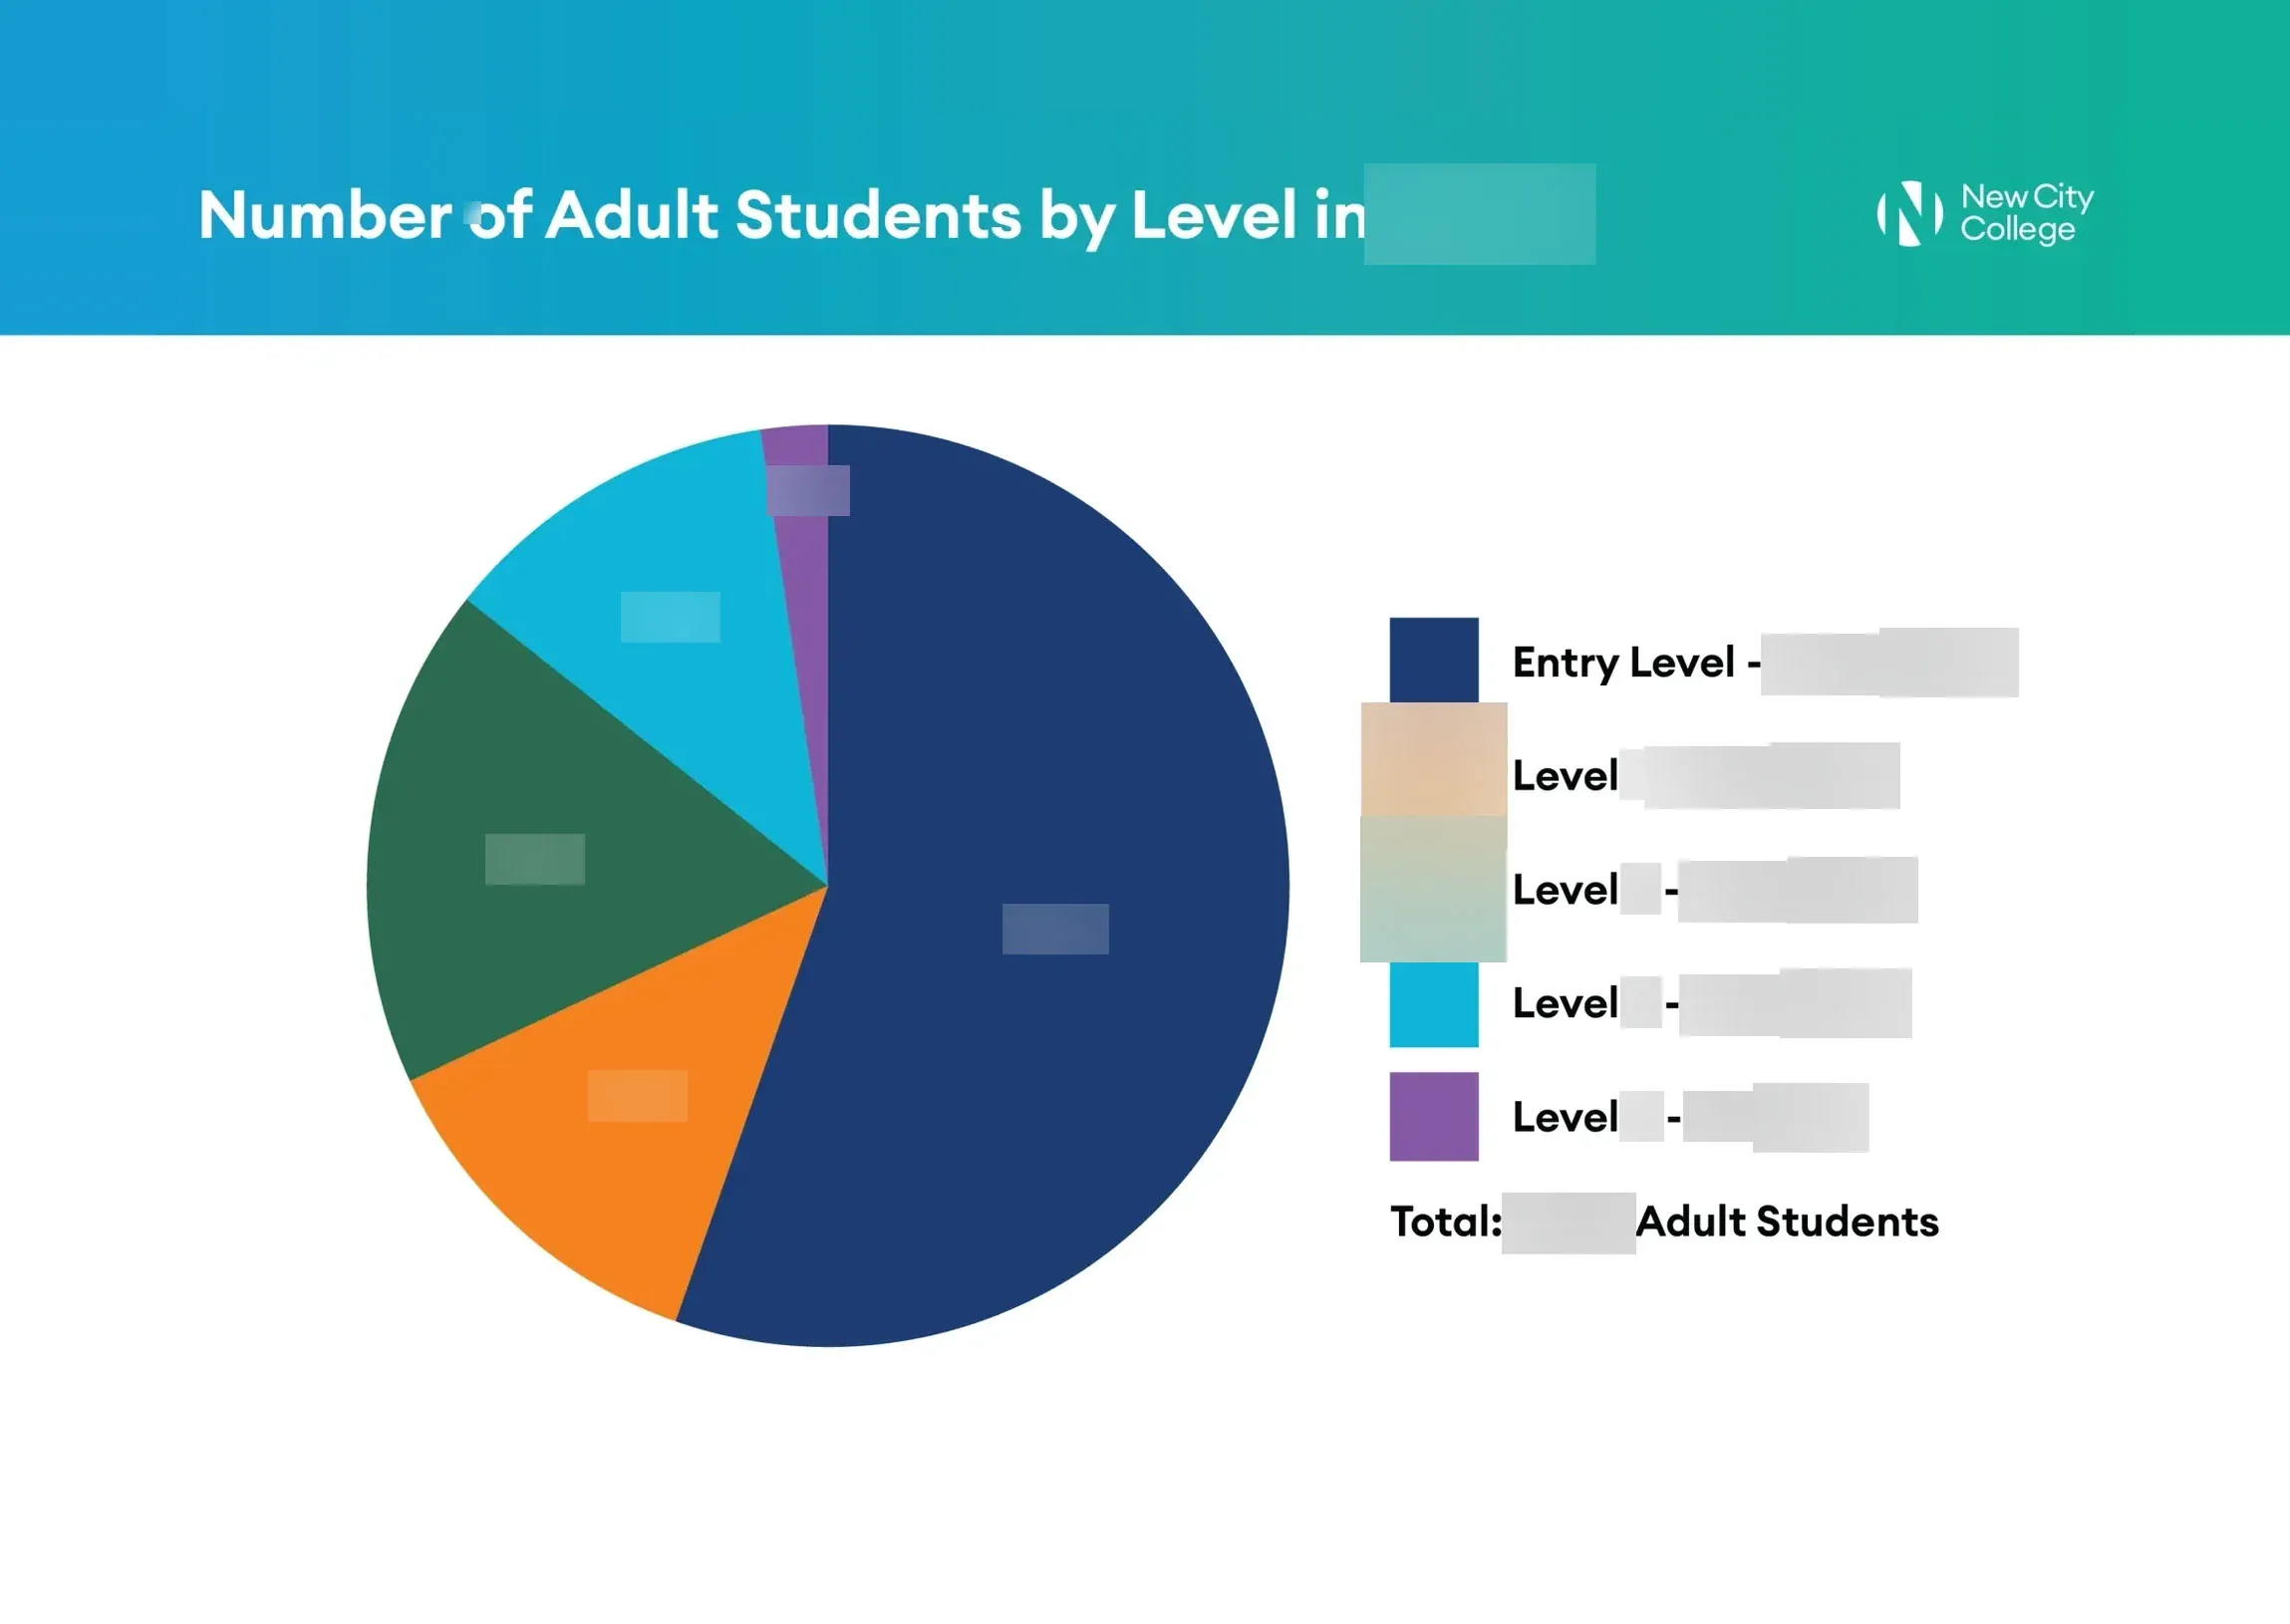
New City College needed a strategic intent briefing that senior leaders and stakeholders could read quickly. The material was policy-heavy and the data complex: borough demographic forecasts, student numbers by age, level and support need, and growth by employment sector.
The college has also grown through a long run of mergers, and the briefing needed to show where it came from.
What I Did
I put the data in order before designing anything. Then I drew every chart in the same style, so the forecasts, sector charts and student numbers read as one document.
For the history I drew a map and timeline of the college's mergers from 1990 to 2024, each set on its borough. Student numbers by level became matching pie charts with totals beside them, easy to compare at a glance.
The Work
Outcomes
7Infographics in the briefing
34 yearsOf mergers on one map, 1990 to 2024